Paper: Zaroubi, S. 2013. The Epoch of Reionization. A chapter in the book entitled ”The first galaxies: Theoretical Predictions and Observational Clues” Wiklind, Tommy, Mobasher, Bahram, Bromm, Volker (Eds.) Astrophysics and Space Science Library 396, page 45.
Modern cosmology presents a comprehensive and quantitively accurate description of the Universe’s properties, since the moment it began until its gas became neutral and transparent, about 380 thousand years after the Big Bang. From these early stages, a billion years later emerged the galaxies and stars-filled Universe, that we know very well. What happened since hydrogen became neutral, and for the subsequent billion years, is still shrouded in mystery and uncertainty. One of the few observational probes, if not the only one, with which to study the first billion years of our Universe’s history is a radiation emitted from neutral hydrogen, known due its wavelength as the 21 cm radiation. With this radiation we can study the Universe’s first billion years and the three eras that it straddles. The first era, known as the Universe’s Dark Ages, refers to the period before the emergence of any astrophysical sources (e.g., first stars). The second era, known as the Cosmic Dawn, is distinguished by the emergence of the first radiation-emitting objects (e.g., first stars), that start heating the hydrogen in the intergalactic medium. The third era, known as the Epoch of Reionization (EoR), is the period in which the hydrogen ionization process became the dominant process, lasting until the Universe is completely ionized and neutral hydrogen beomce scarce. The main aim of my current research is to detect The Epoch of Reionization and Cosmic Dawn (see Figure 1) with the European LOFAR radio telescope and the international Square Kilometer Array.
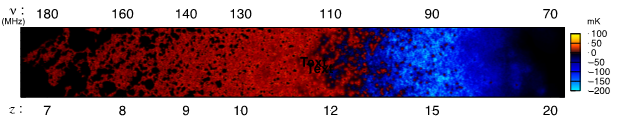
Figure 1: This figure shows a sketch of the likely development of the differential brightness temperature of the 21 cm signal emitted from neutral hydrogen during the Cosmic Dawn (z=20-12, i.e., the blue part of the map) and the EoR (z=12-7, i.e., the red part of the map), in absorption and in emission, respectively. Notice that the absorption features (negative δTb) can be much deeper than those of the emission (positive δTb) (The figure by Dr. Raghunath Ghara).